What is a Session in GA4?
A Weekly Sessions Discrepancy is one of the most common issues in GA4. Or if I want to make more realistic this is the most common question that business users who review your report ask – why weekly Session Count differ from weekly sessions on yearly horizon? Lets start together to review why this is happening and what approach is correct. Before we dive into the problem lets step back and identify what is a session and how this differs from UA to GA4.
A session in GA4 represents a group of user interactions (events) within a given time frame. These interactions can include page views, events, transactions, and more.
Key Differences from Universal Analytics:
- Event-based Model: Unlike Universal Analytics, which was based on sessions and pageviews, GA4 is event-based. Every interaction is recorded as an event.
- Session Start: A session in GA4 starts with a “session_start” event. This event is triggered when a user opens your app or website.
- Session Duration: The default session duration in GA4 is 30 minutes of inactivity. If the user interacts with the site or app after 30 minutes of inactivity, a new session will start.
Session Metrics in GA4:
- Sessions: Total number of sessions.
- Engaged Sessions: Sessions that lasted 10 seconds or longer, had 1 or more conversion events, or had 2 or more pageviews or screenviews.
- Engaged Sessions per User: Average number of engaged sessions per user.
- Engagement Rate: The percentage of sessions that were engaged.
Analyzing Sessions in GA4:
- Reports: The standard reports in GA4 provide metrics on sessions and user interactions. For instance, the “Life Cycle” reports, particularly the “Engagement” section, offer detailed insights.
- Exploration: GA4’s Exploration tool allows you to create custom reports to dive deeper into session data, segment sessions, and analyze user behavior in detail.
- Segments: You can create segments based on sessions to filter and analyze specific groups of user interactions.
Setting Up Sessions in GA4:
- Session Timeout Settings: You can adjust the session timeout settings in the GA4 admin under “Data Streams” > “Web” > “More Tagging Settings” > “Session Timeout.”
- Custom Events: While GA4 automatically tracks many events, you can set up custom events to capture specific interactions that are important for your analysis.
Best Practices:
- Understand User Journeys: Use session data to understand how users navigate through your site or app.
- Focus on Engagement: Look beyond the number of sessions and focus on engaged sessions to get a better picture of user interaction quality.
- Utilize Segments: Create segments based on different session criteria to compare behaviors and identify patterns.
The Weekly Sessions Discrepancy Issue!
The discrepancies on the session count for the same week when viewing the entire year can be attributed to several potential factors. Here are some common reasons for such discrepancies in GA4 data:
1. Data Sampling
When you look at a large date range (like an entire year), GA4 might apply data sampling if your report exceeds the threshold of events. This can result in slightly different numbers compared to when you look at a smaller date range (like a single week). Sampling can lead to less precise data, especially for specific periods within the larger date range.
2. Data Processing Latency
GA4 might take some time to process and finalize the data. If you are looking at very recent data (like last week), it might still be undergoing processing. In contrast, looking at data for the entire year might only show fully processed data up to the point where the system is completely updated.
3. Data Filters and Segments
Ensure that there are no filters or segments applied when viewing the yearly data that are not applied when viewing the weekly data. Filters can exclude certain data points, leading to discrepancies.
4. User Interface Differences
Sometimes, the user interface might default to different settings when you change the date range. Double-check that all settings, including date range definitions (e.g., how the week is defined), are consistent.
5. Retention of Historical Data
GA4 has different data retention settings. If you have a data retention setting that affects how long certain data points are kept, this could cause discrepancies when looking at different date ranges.
Steps to Investigate the Discrepancy:
- Check Sampling Rate:
- In GA4, check if a sampling rate is indicated on the report. This is usually noted at the top of the report. If sampling is applied, consider using a smaller date range or applying a filter to reduce the number of events.
- Ensure Consistency in Filters and Segments:
- Verify that no additional filters or segments are applied to the yearly data that are not applied to the weekly data.
- Compare Data Processing Status:
- Check if there are any notes or alerts about data processing delays for recent data.
- Review Data Retention Settings:
- Go to Admin > Data Settings > Data Retention and ensure your settings are not affecting the data available for different date ranges.
- Look at Different Reports:
- Compare the sessions in different reports (e.g., Life Cycle > Engagement > Overview vs. Explorations) to see if the discrepancy persists across different reporting interfaces.
What happens in reality?
When all the above are not enough to solve your problem with the weekly sessions discrepancy here is what you need to look into. The discrepancy you’re experiencing could indeed be related to how sessions are counted when they span across the boundary of weeks. Here’s a detailed explanation of how session overlap can affect your data and how to explain it:
Understanding Session Overlap
- Session Definition:
- A session in GA4 starts when a user begins interacting with your site or app and ends after 30 minutes of inactivity or when the day ends at midnight.
- Weekly Data Aggregation:
- When you look at data for a single week (e.g., last week), GA4 counts sessions that started and ended within that week.
- When you look at data for the entire year split by week, GA4 counts sessions that started within each week. Sessions that start at the end of one week and continue into the next week might be counted in the week they started.
Explaining the Discrepancy:
- Single Week View:
- When you view sessions for a single week, GA4 counts all sessions that started and ended within that week. This also includes sessions that started in the previous week but ended in the current week.
- Yearly View Split by Week:
- When viewing the entire year split by week, GA4 might count sessions that started in the previous week and continued into the current week as part of the previous week’s total. This means the sessions spanning the week boundary might not be double-counted but rather attributed to the starting week.
Practical Example:
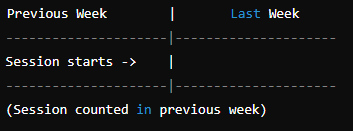
- Single Week (Last Week): If a session started on Sunday night of the previous week and continued into Monday morning of last week, it might be counted in last week’s total.
- Yearly Split by Week: The same session might be counted in the previous week’s total when viewing the entire year, as it started in the previous week.
Visualizing the Concept:
Single Week (Last Week):
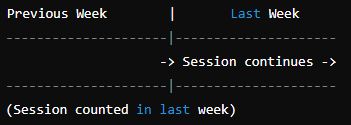
Yearly View Split by Week:
How to Communicate this to your clients?
- Session Count Differences:
- Explain that the weekly sessions discrepancy arises because sessions spanning across week boundaries are counted differently when viewed in isolation versus within a broader context.
- Context of Reporting:
- Highlight that viewing data week-by-week for the entire year attributes sessions to the week they started in, whereas viewing a single week counts sessions based on their presence within that week.
- Impact on Analysis:
- Emphasize that this is a normal behavior in analytics and it’s crucial to consider how session boundaries and reporting periods can impact session counts.
By understanding and explaining the session overlap, you can provide a clear and concise rationale for the observed discrepancies in your GA4 data.
In one sentence?
The weekly sessions discrepancy arises because sessions spanning the end of one week and the start of another are counted differently when viewing a single week versus the entire year split by weeks.
The above is the most important message as will clarify to you and your data readers (decision makers usually) any data discrepancies. None of the views is wrong but actually both are correct! It is the different view of the same coin!
If that gets you even more confused than what you were before Tatitech is always happy to help understand your data. We are here to make your data into a story!
See Also:
Contact Tatitech to get expertise consulting services in Digital space